

Intro: This data visualization project researches on how different variables affect people’s attitudes towards online dating. I started off with a giant spreadsheet of data sourced from Pew Research Center, with 2253 rows of entries and 68 variables. The data was collected in year 2012. My goal was to find correlations between those variables.
I was interested in researching how different variables affect these four mentalities towards online dating: 1. “online dating is a good way to meet people”, 2. “online dating allows people to find a better match for themselves because they can get to know a lot more people,“ 3. "people who use online dating sites are desperate, “ and 4. “online dating keeps people from settling down because they always have options for people to date.”
PART ONE: I was interested in how age, education and income affect the above four different attitudes towards online dating.
In the raw data, numerical number 1 represents "agree," and 2 represents "disagree." One of the first steps was to convert numerical number 2 into "0," and then convert number 1 and 0 into logical data.
Exploratory Charts: Below are the three charts for how age, education, and income affect the four different attitudes towards online dating.
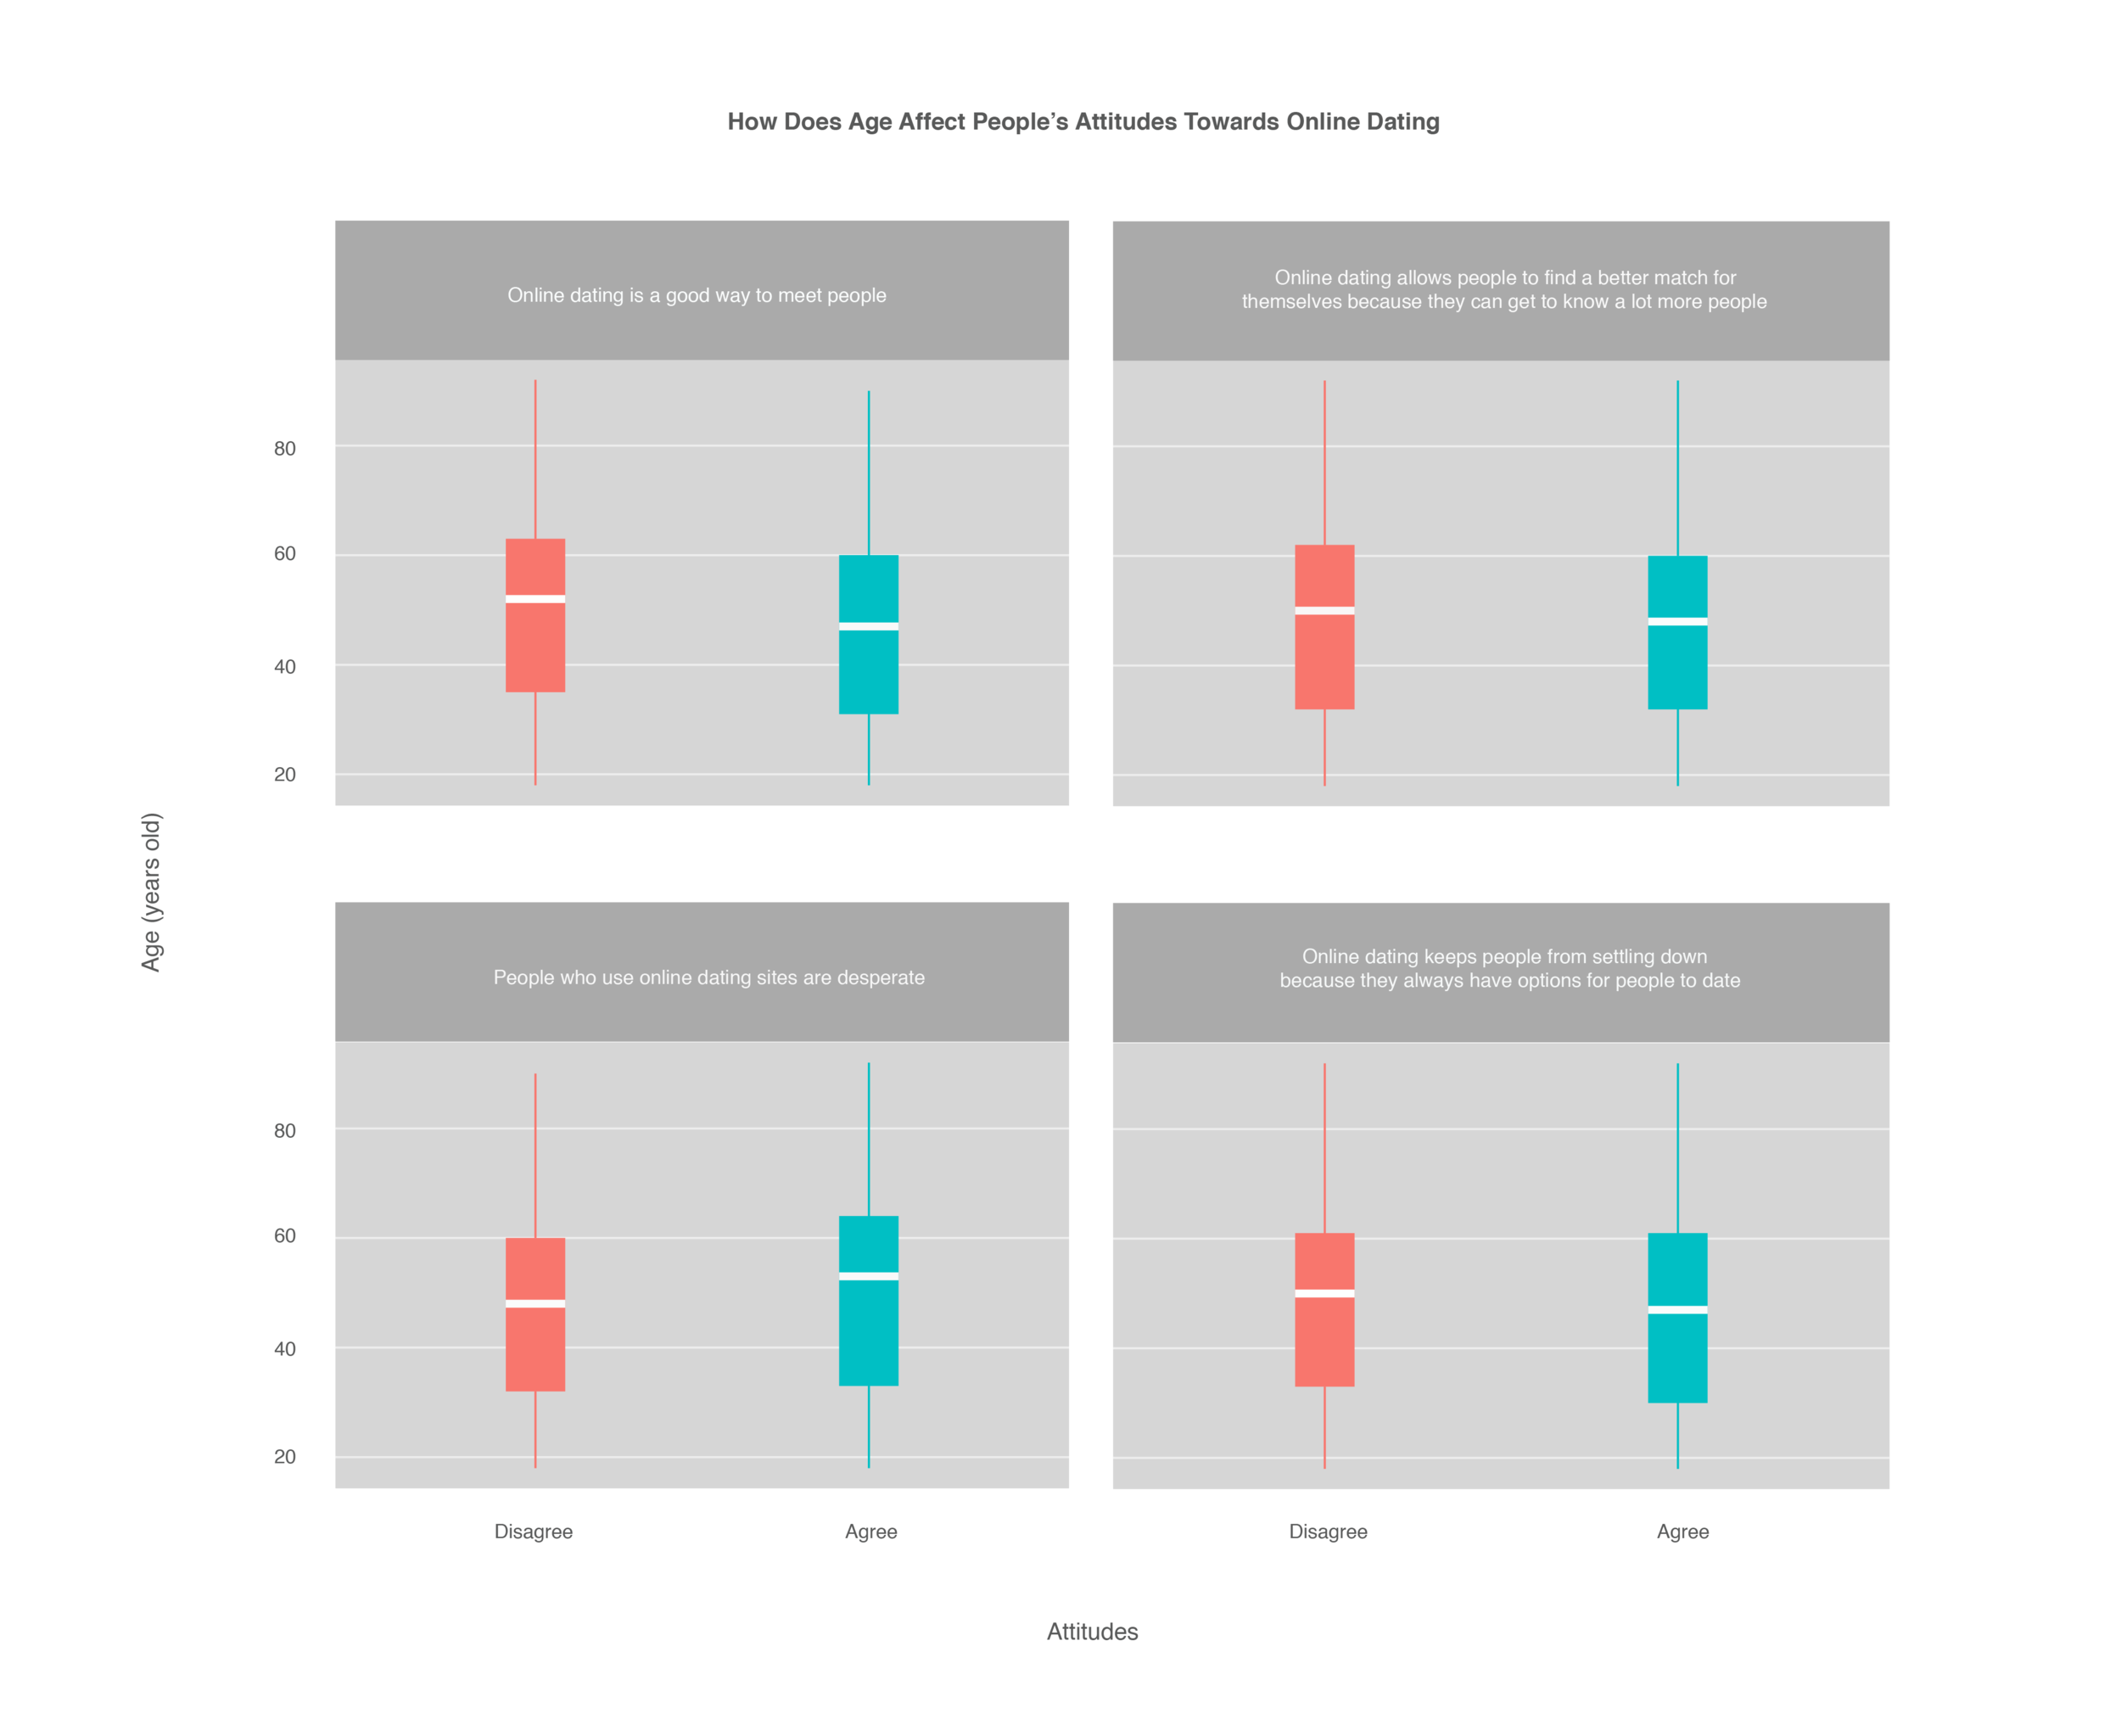
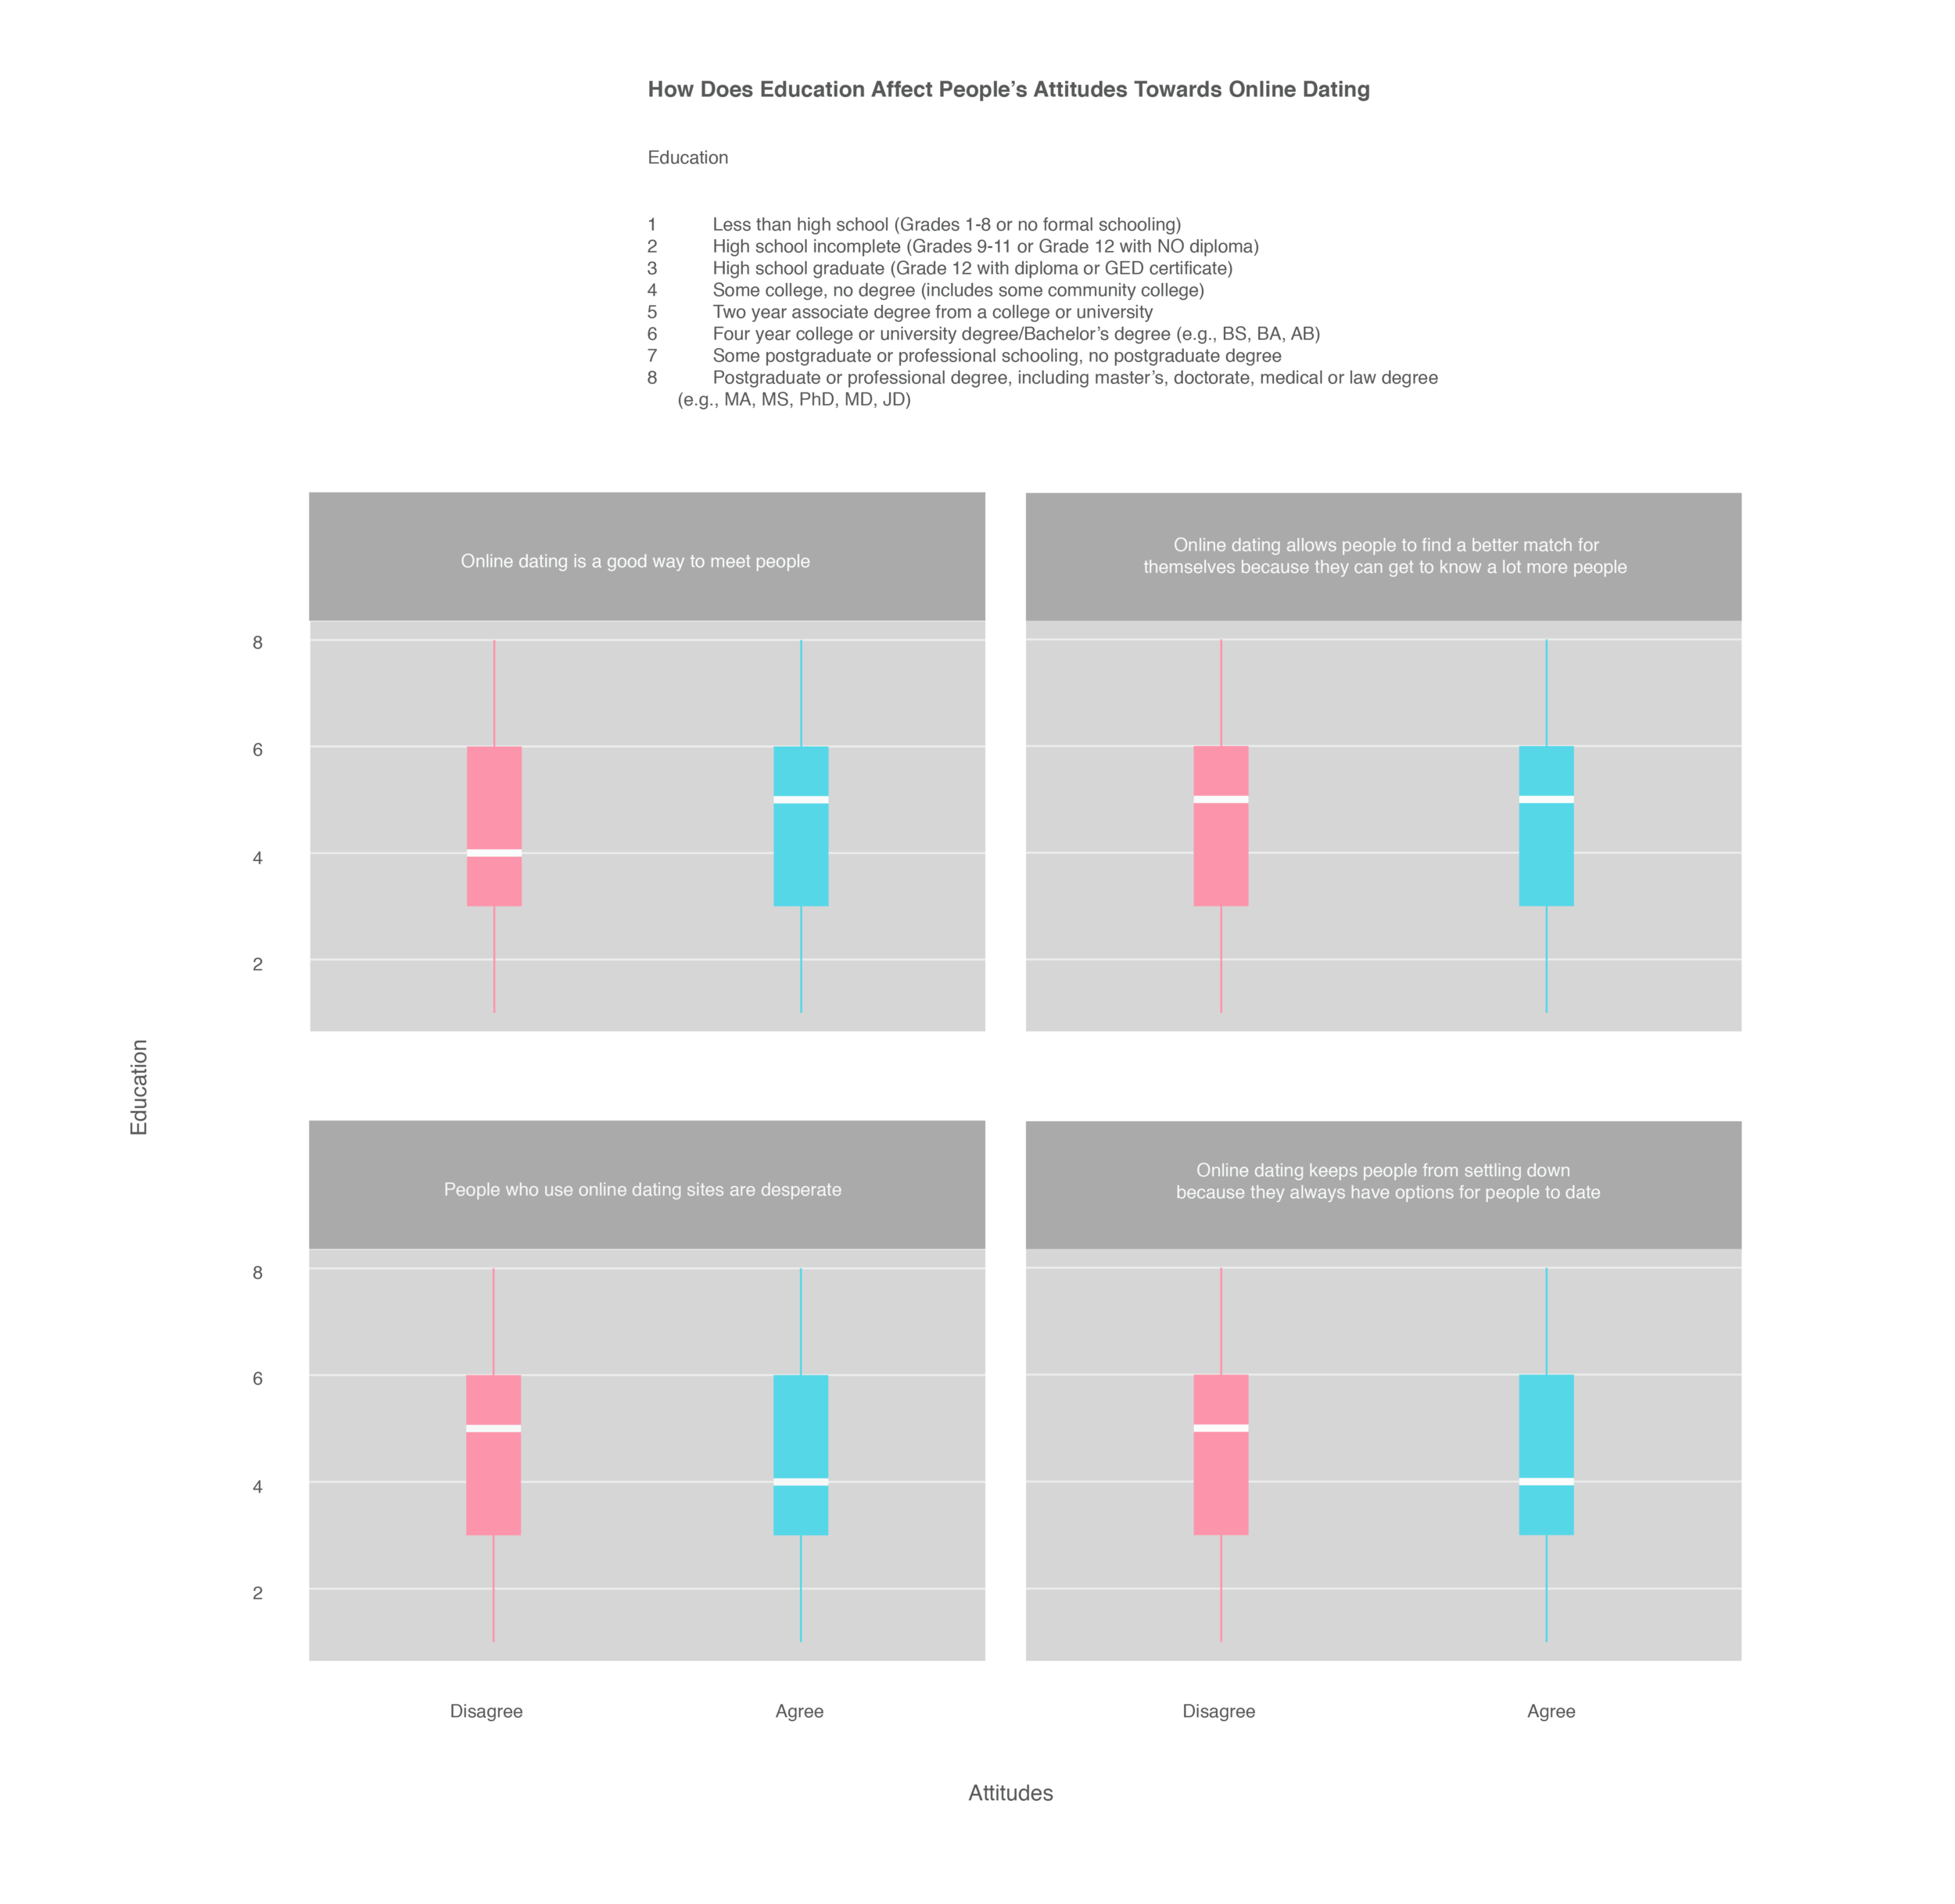
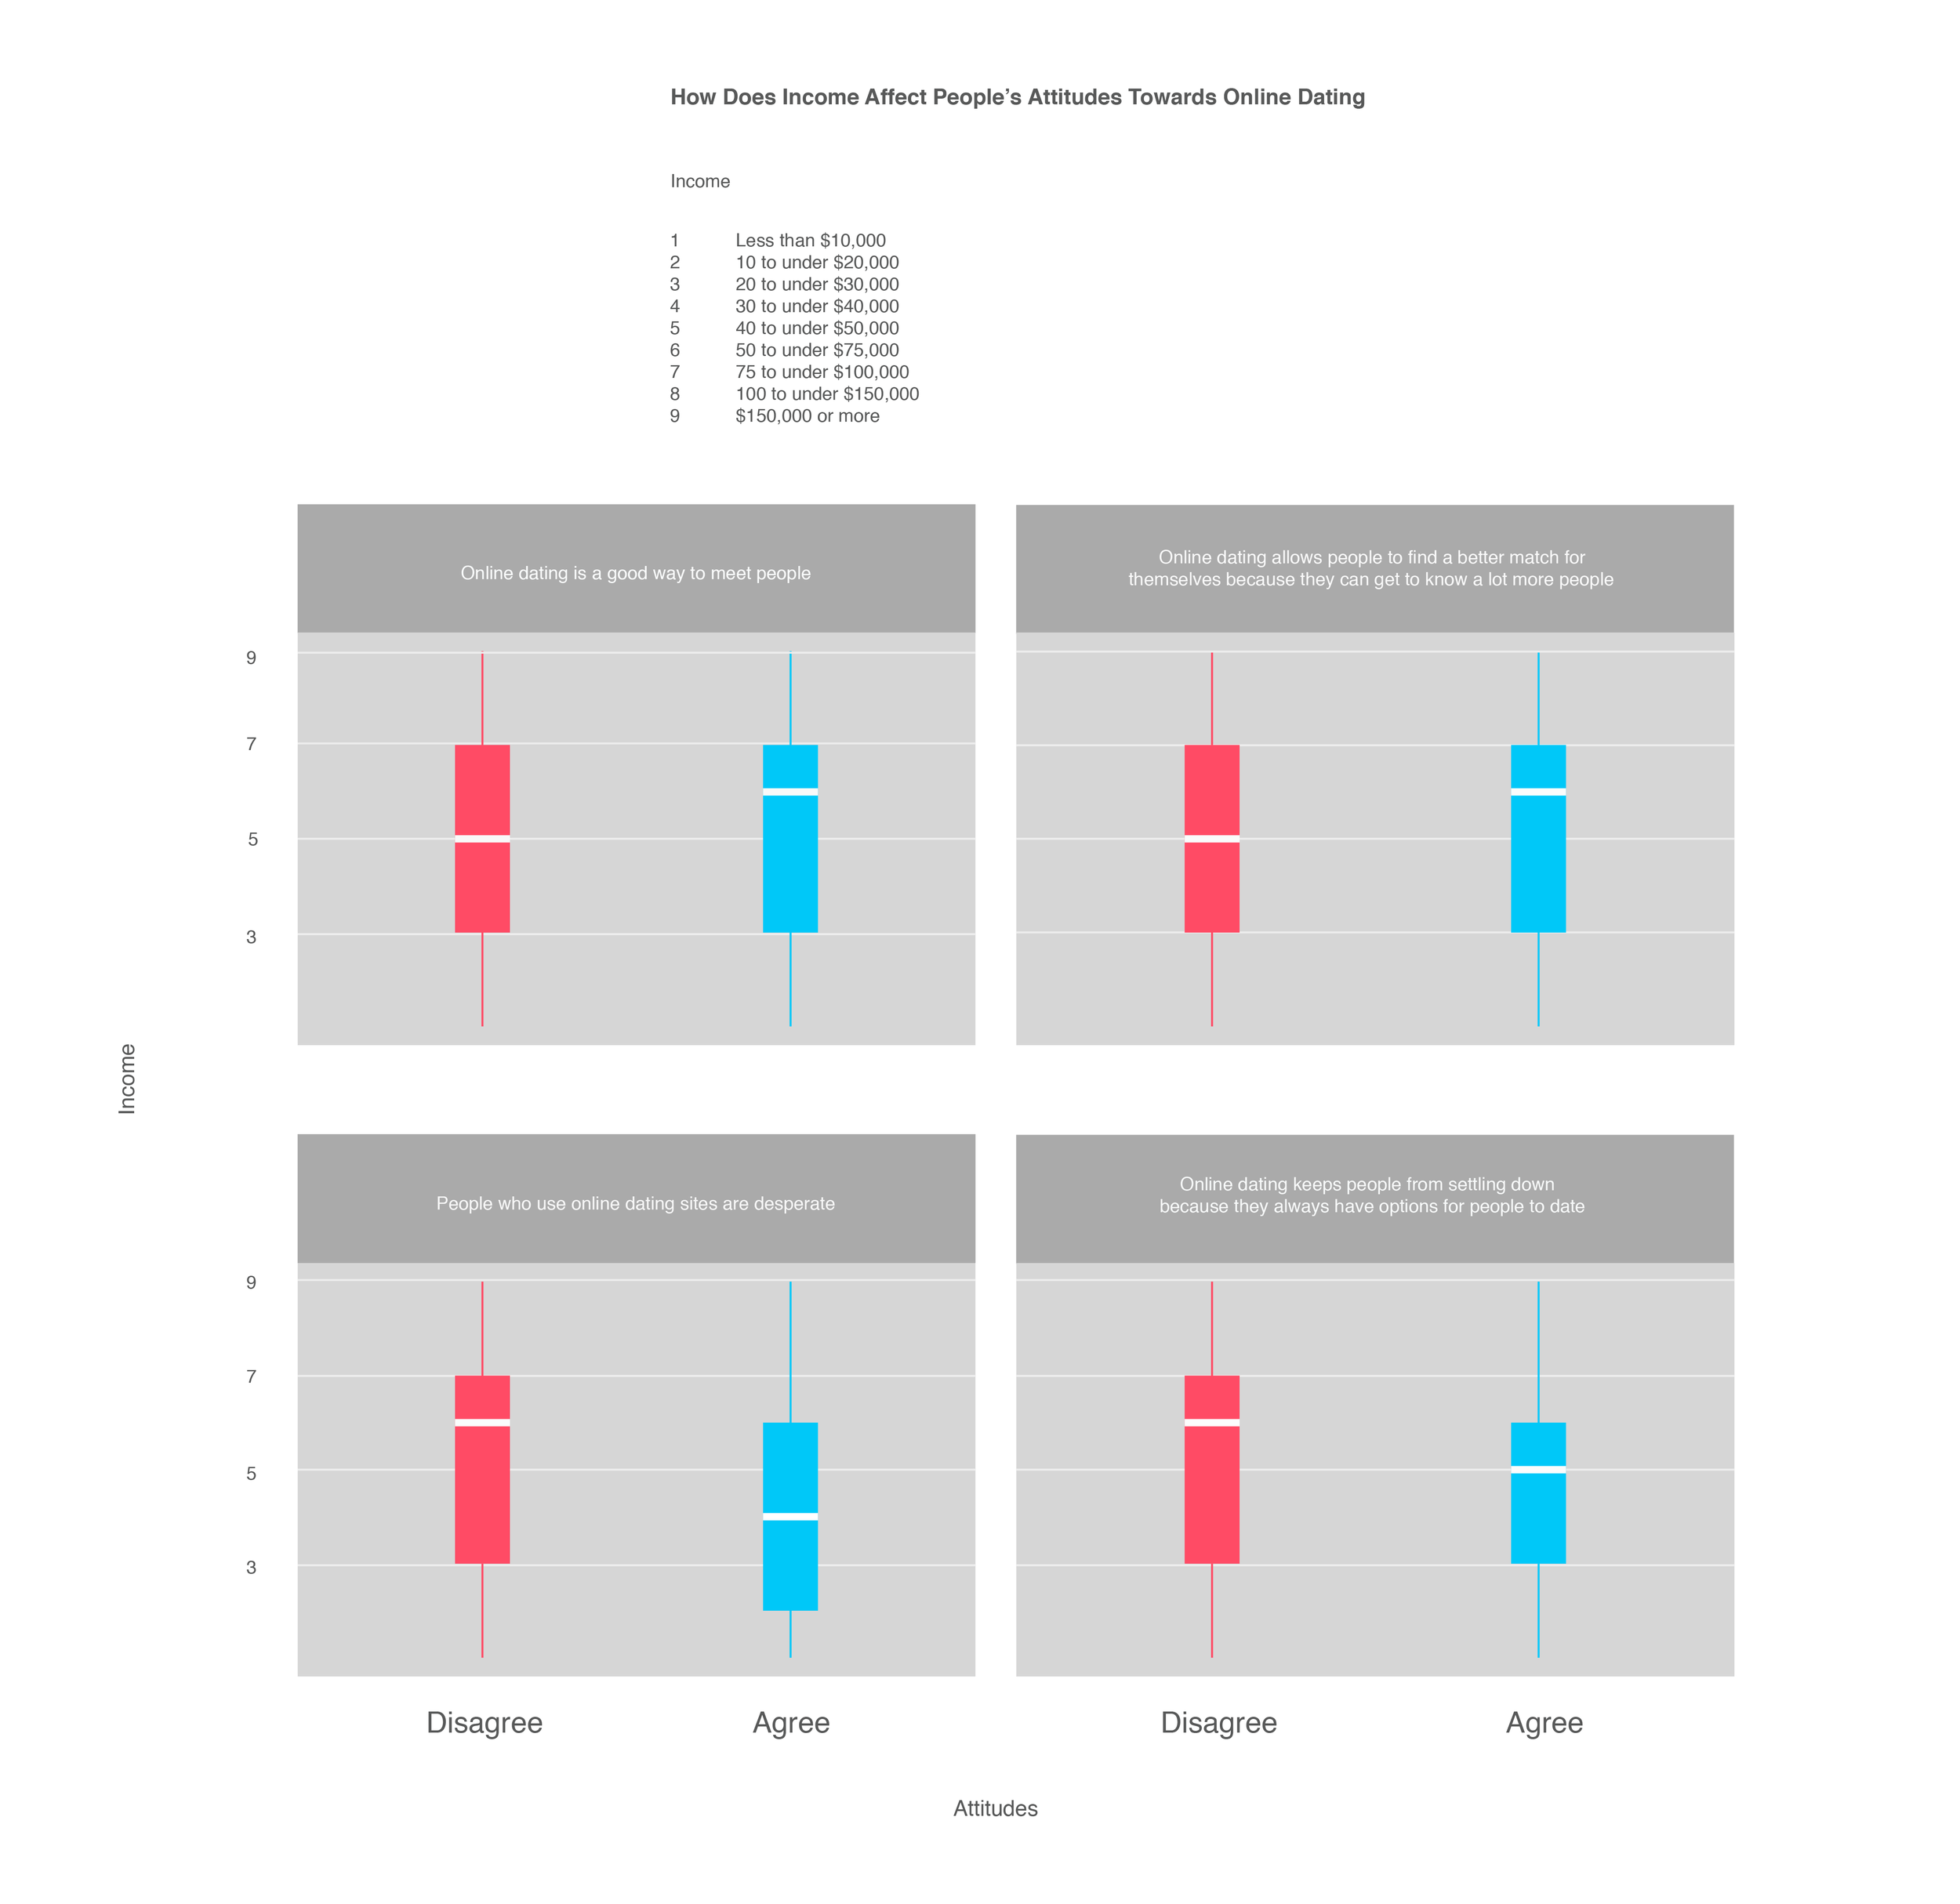
Final Chart: For the final polished chart, I got rid of the data for education because the effects of income and education tend to be similar to each other. I also got rid of the data for disagreeing with all those four attitudes towards online dating because the data for agreeing with those attitudes is far more interesting. Then I flipped the X and Y coordinates and consolidated the charts for age and income. From the chart we can see that there is not much difference in age between people who view online dating positively and negatively. However, there is a clear evidence that people who have a more positive view towards online dating are on the higher end of the income spectrum:
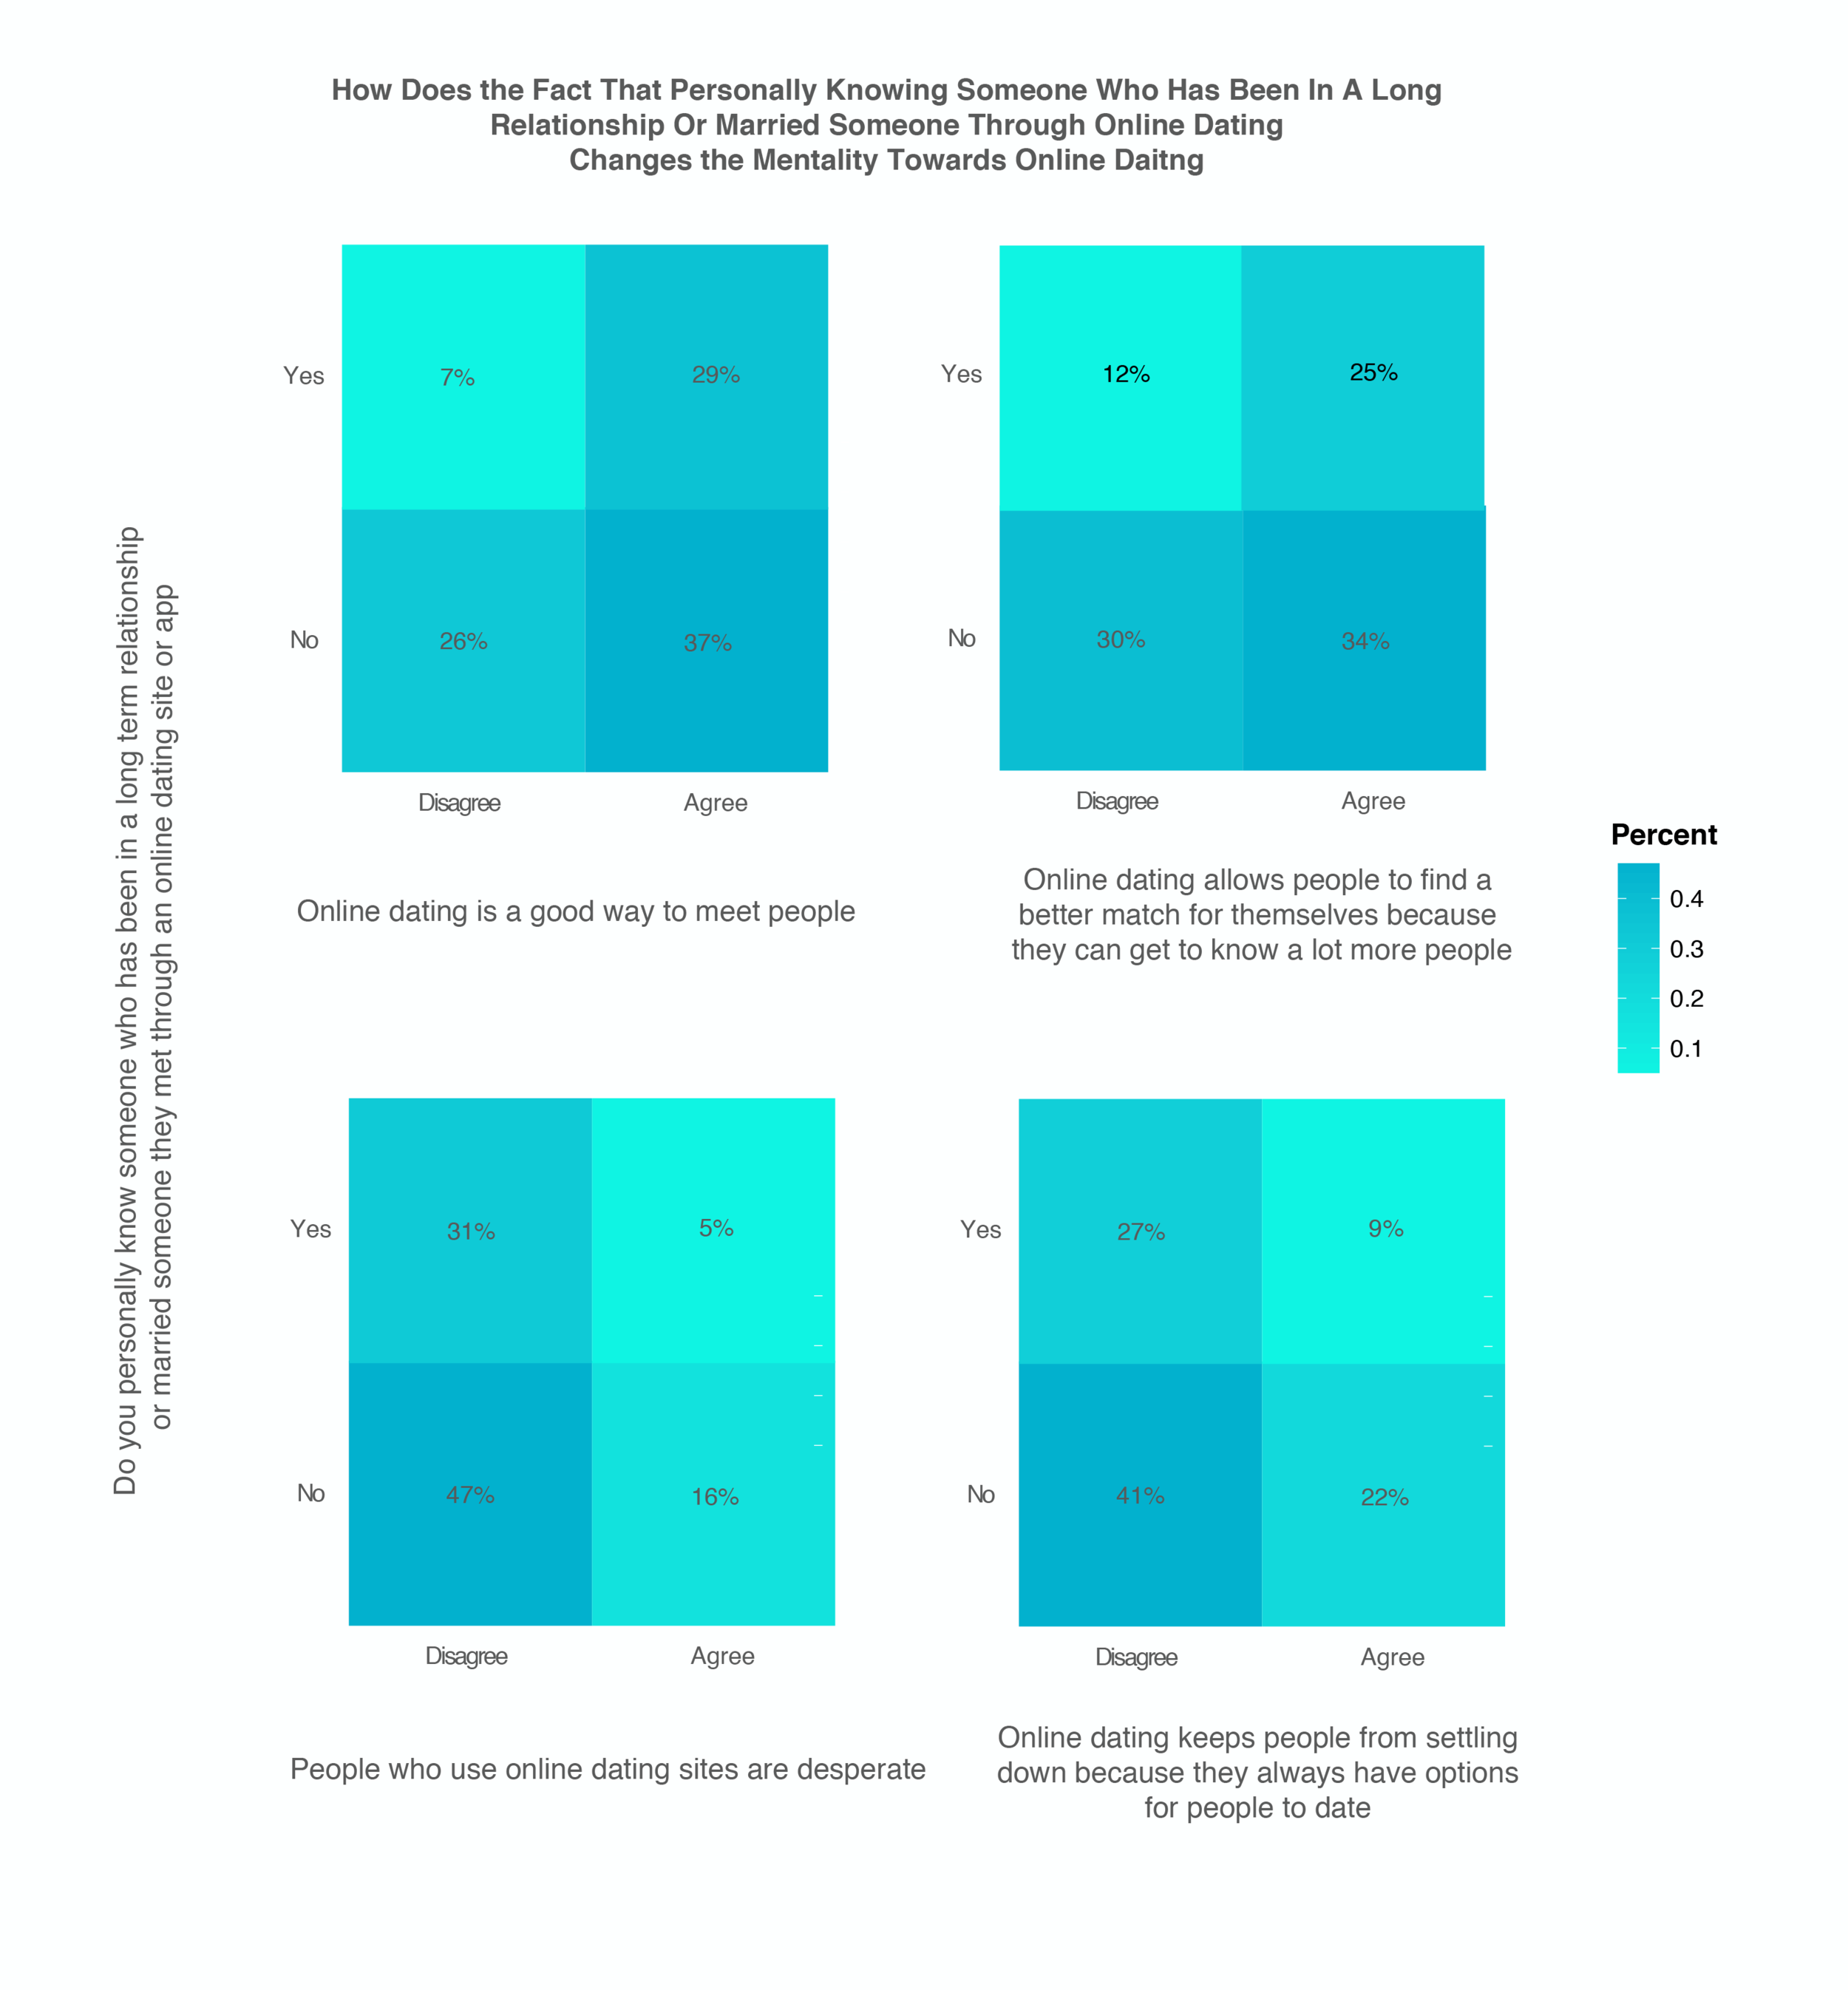
PART TWO: I was interested in investigating how the following factors affect the above attitudes towards online dating: whether the respondent has ever flirted online, whether the respondent has personally used online dating site, and whether the respondent has personally known someone who has been in a long term committed relationship with another person whom he or she has met through online.
I chose to use geom_tile charts because it can clearly present the relationship between two variables by calculating the percentage.
Exploratory Chart:
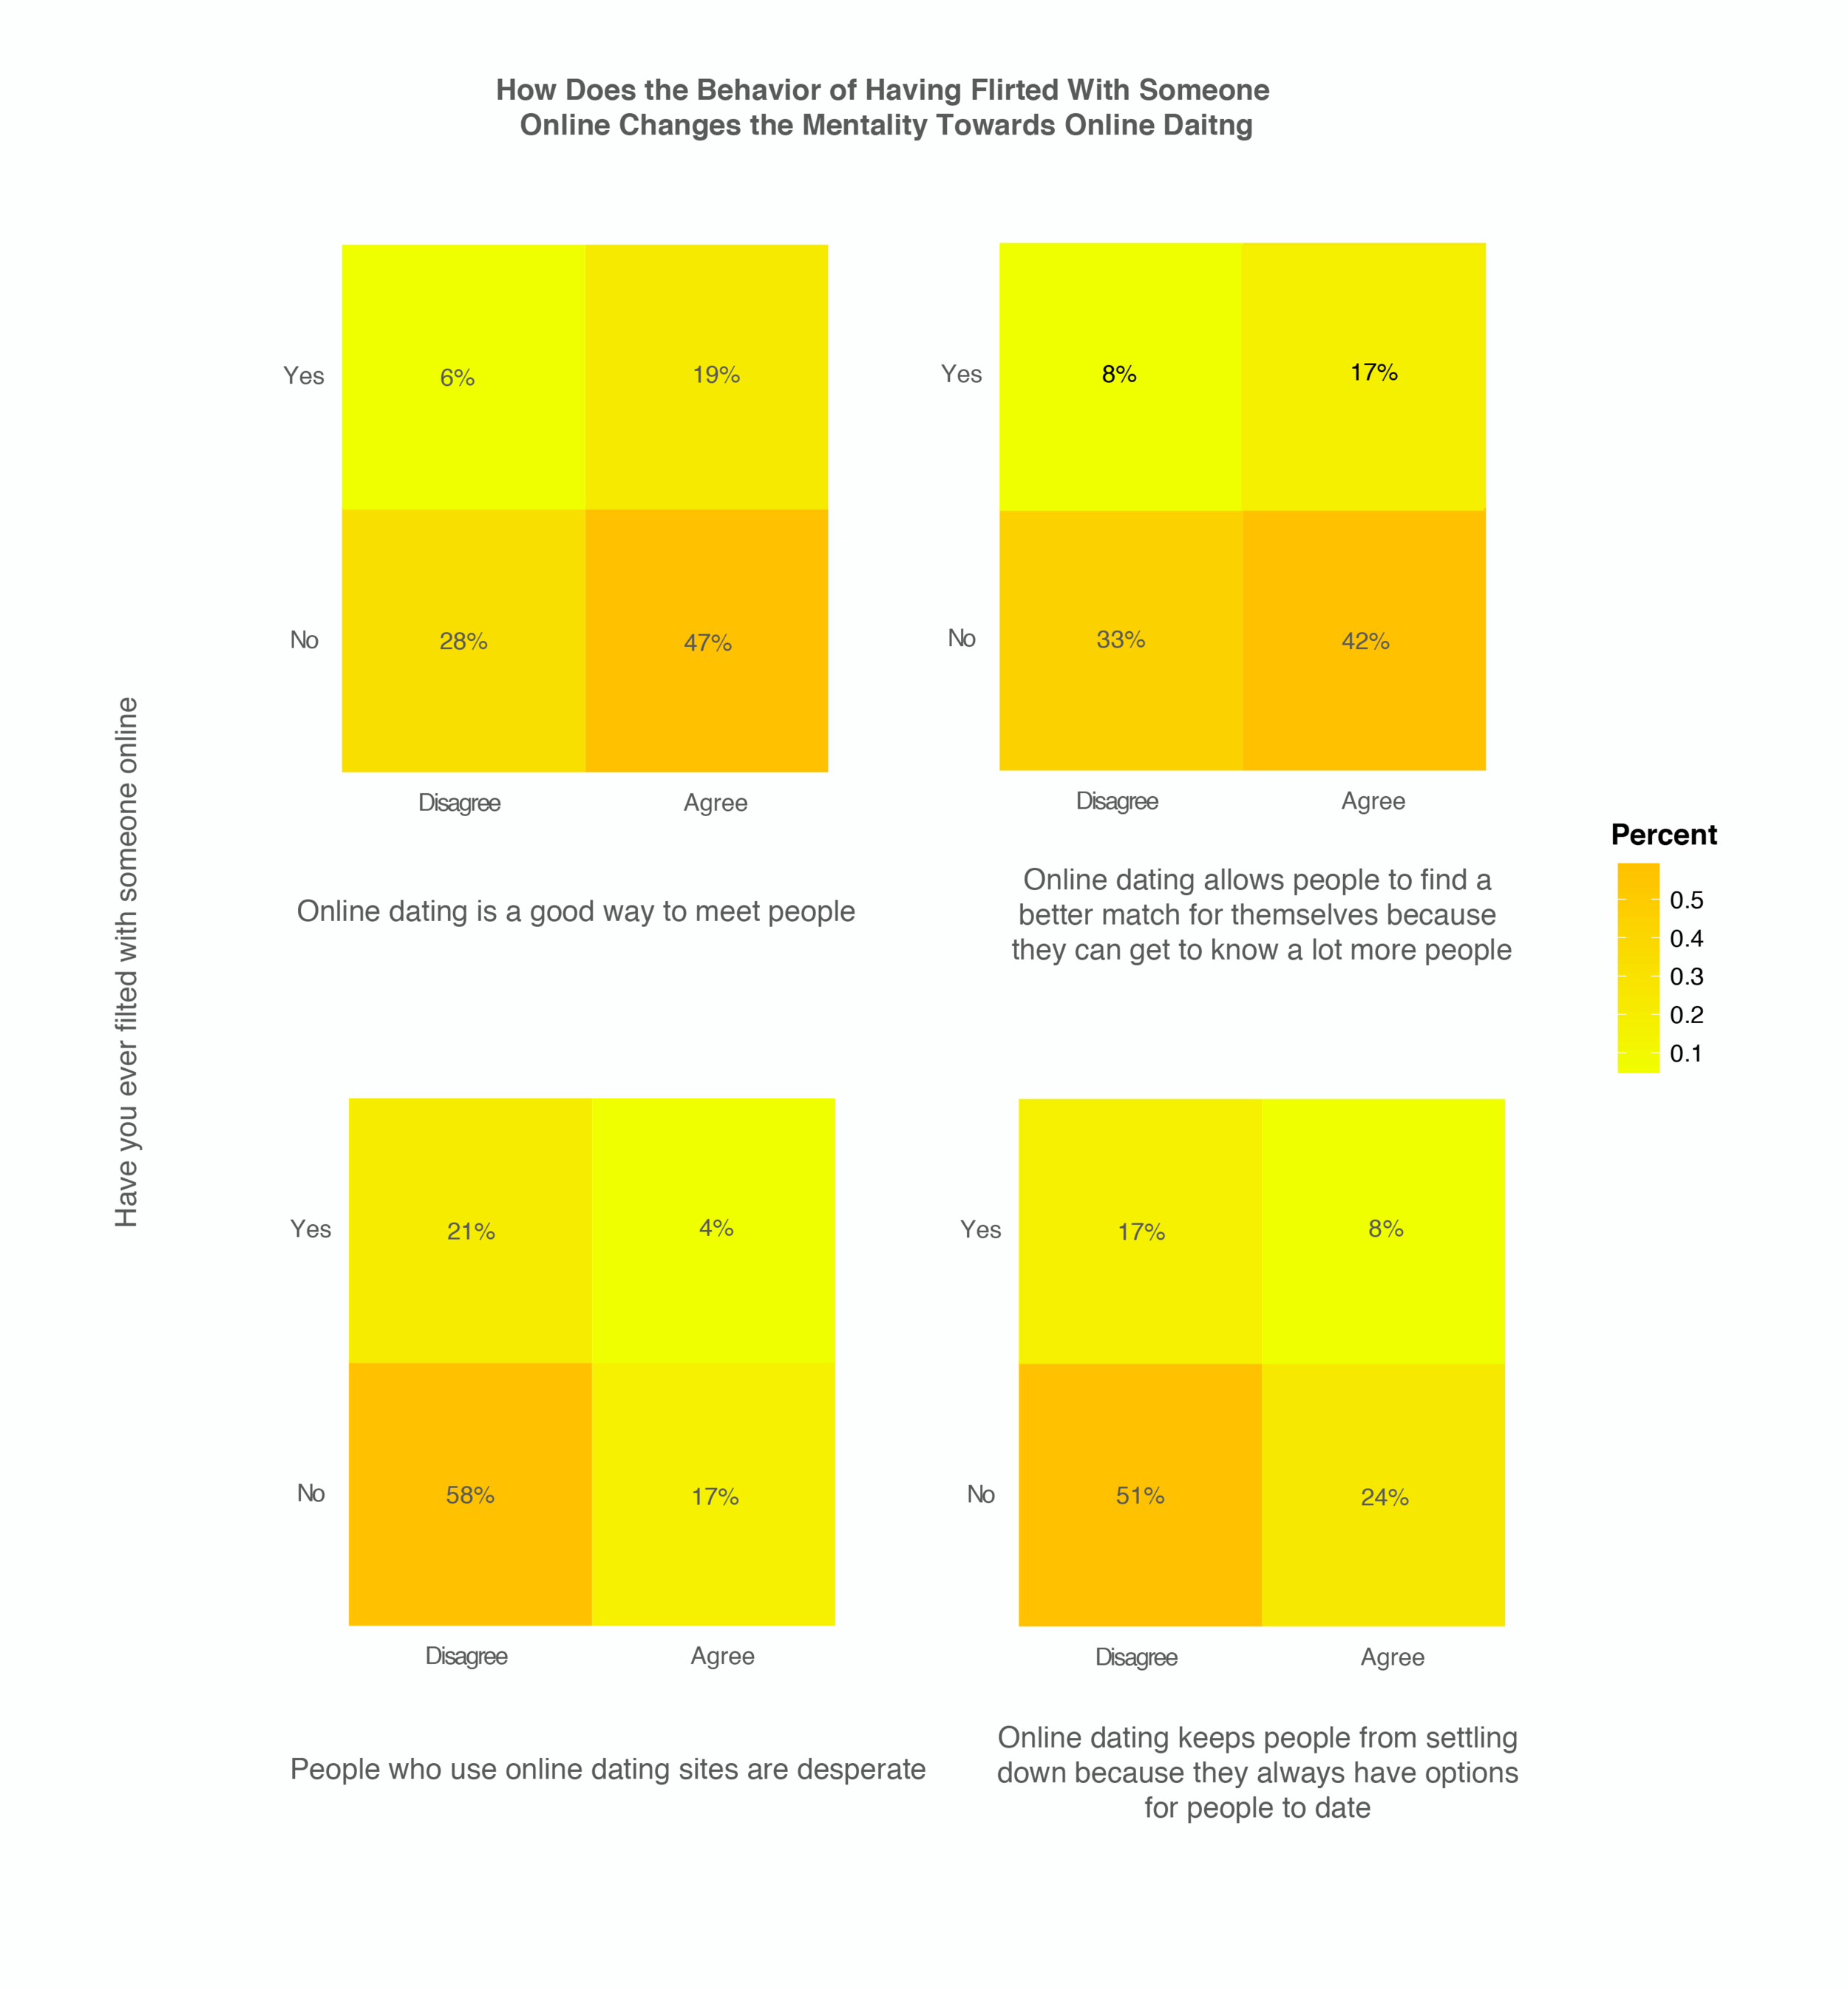

Final Chart: For the final polished chart, I picked two small charts from above that seem the most interesting. This final chart presents the relationship between the behavior of having tried online dating and the mentality towards online dating. To my surprise and the contrary to the common criticism of online dating that it prevents people from setting down because of the abundant choices, for those who have personally tried online dating, only 3% agree with the common criticism of online dating. Another surprising result is that the majority, 68% of the people who have personally never tried online dating disagree that people who use online dating sites are desperate. This result shows a generally positive view towards online dating among the public, which clearly has changed significantly from the public view towards online dating in the past: